Interactive Profiles
Explore every kilometer of the route with detailed terrain, elevation profiles, and historical overlays

● 1969, 2025 & 2026 Guides — FREE TO ALL READERS
Interactive profiles. Stage-by-stage narratives. 30+ years of cycling's greatest race, visually reconstructed.
Access the CollectionClick any year to navigate its guide
Every Tour receives the complete treatment
Explore every kilometer of the route with detailed terrain, elevation profiles, and historical overlays
Rich narratives for each stage, documenting tactics, drama, and the moments that defined the race
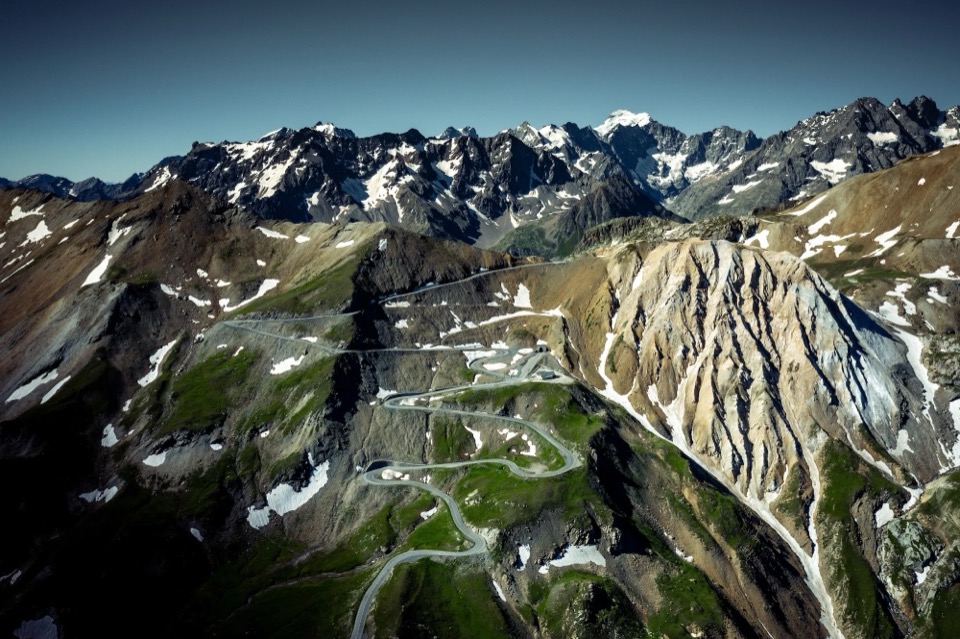
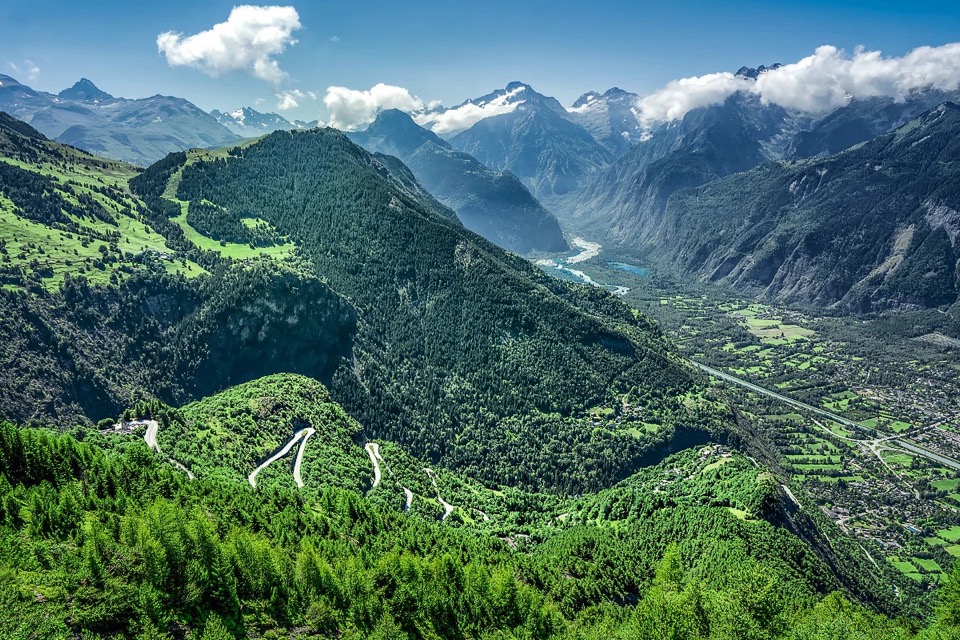
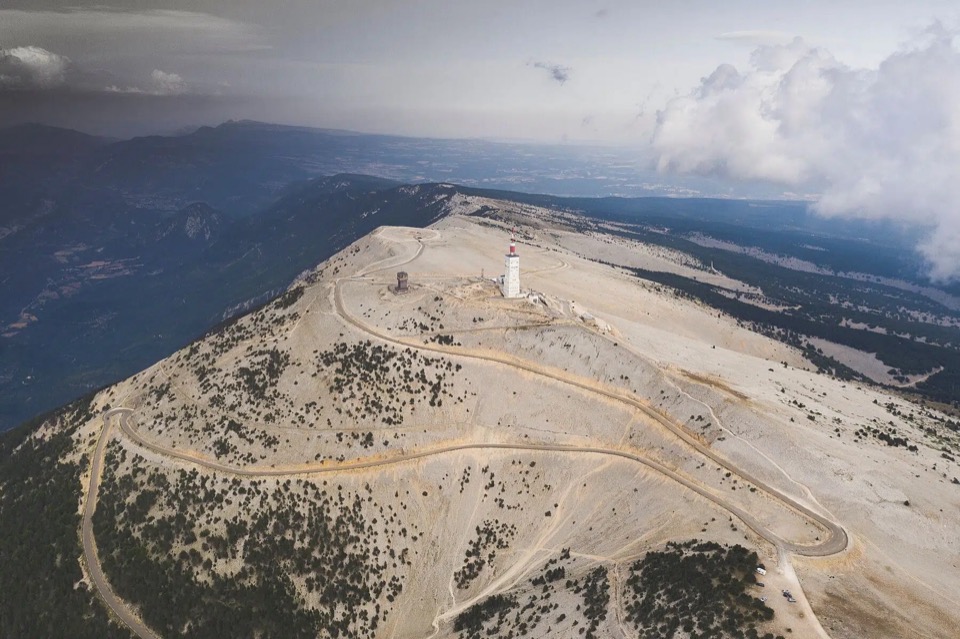
Photographs, route diagrams, and carefully curated visuals that bring each edition to life
Full access to the archive—including years we're still finishing. This is early access pricing while we build out the remainder; as a thank you, we'll keep you locked in at $10/year on the annual plan. Promotion ends when the years are complete.
Early access · while we add remaining years
Early access pricing while the archive grows. Promotion ends when the years are complete, but you'll stay at $10/year going forward.
Billed monthly, cancel anytime · early access while we finish remaining years
Start with the 1969, 2025, and 2026 editions - free access, no credit card required